October’s Peninsula housing reports tell two stories at once: buyers were still paying above asking on average, but monthly median sale prices did not move in the same direction across cities.
Across the 11 single-family markets covered here, the reported average percentage of list price received ranged from 104% in Menlo Park to 113% in Atherton. Ten cities recorded a median of 12 days or less on the market. Foster City was the exception at 20 days.
That does not mean every home sold over asking, or that every owner’s property gained value. The city-by-city figures—and the number of homes behind them—matter more than a single Peninsula-wide headline.
October 2026: the 11-city snapshot
The figures below cover single-family homes. “Sale-to-list” is the reported average percentage of list price received; “days” means median days on market. Prices per square foot are averages, not medians.
Mid-Peninsula
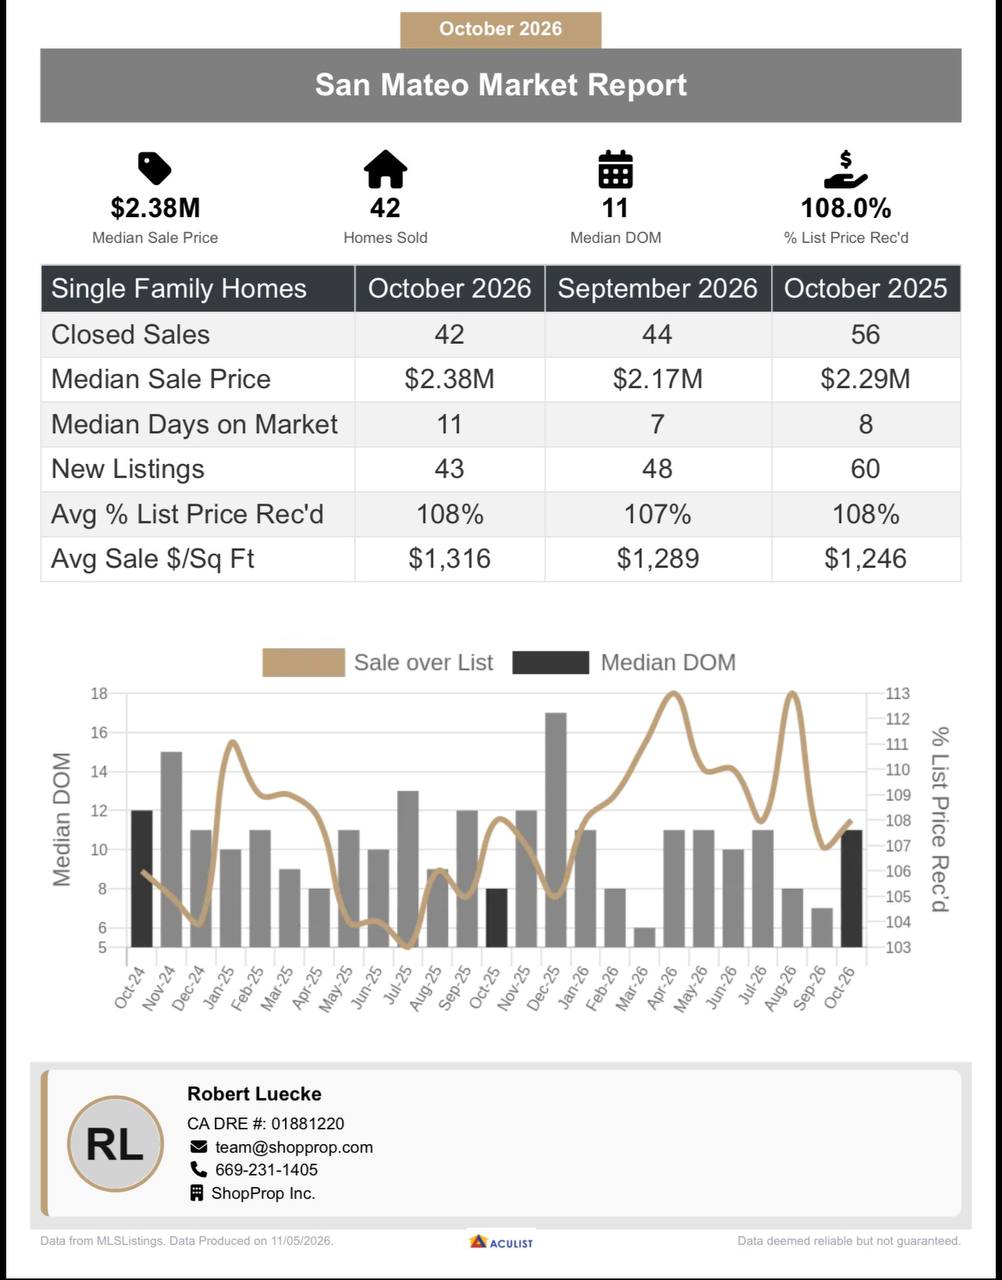
- San Mateo: $2.38 million median sale price; $1,316 average per square foot; 11 median days; 42 closed sales; 43 new listings; 108% average sale-to-list.
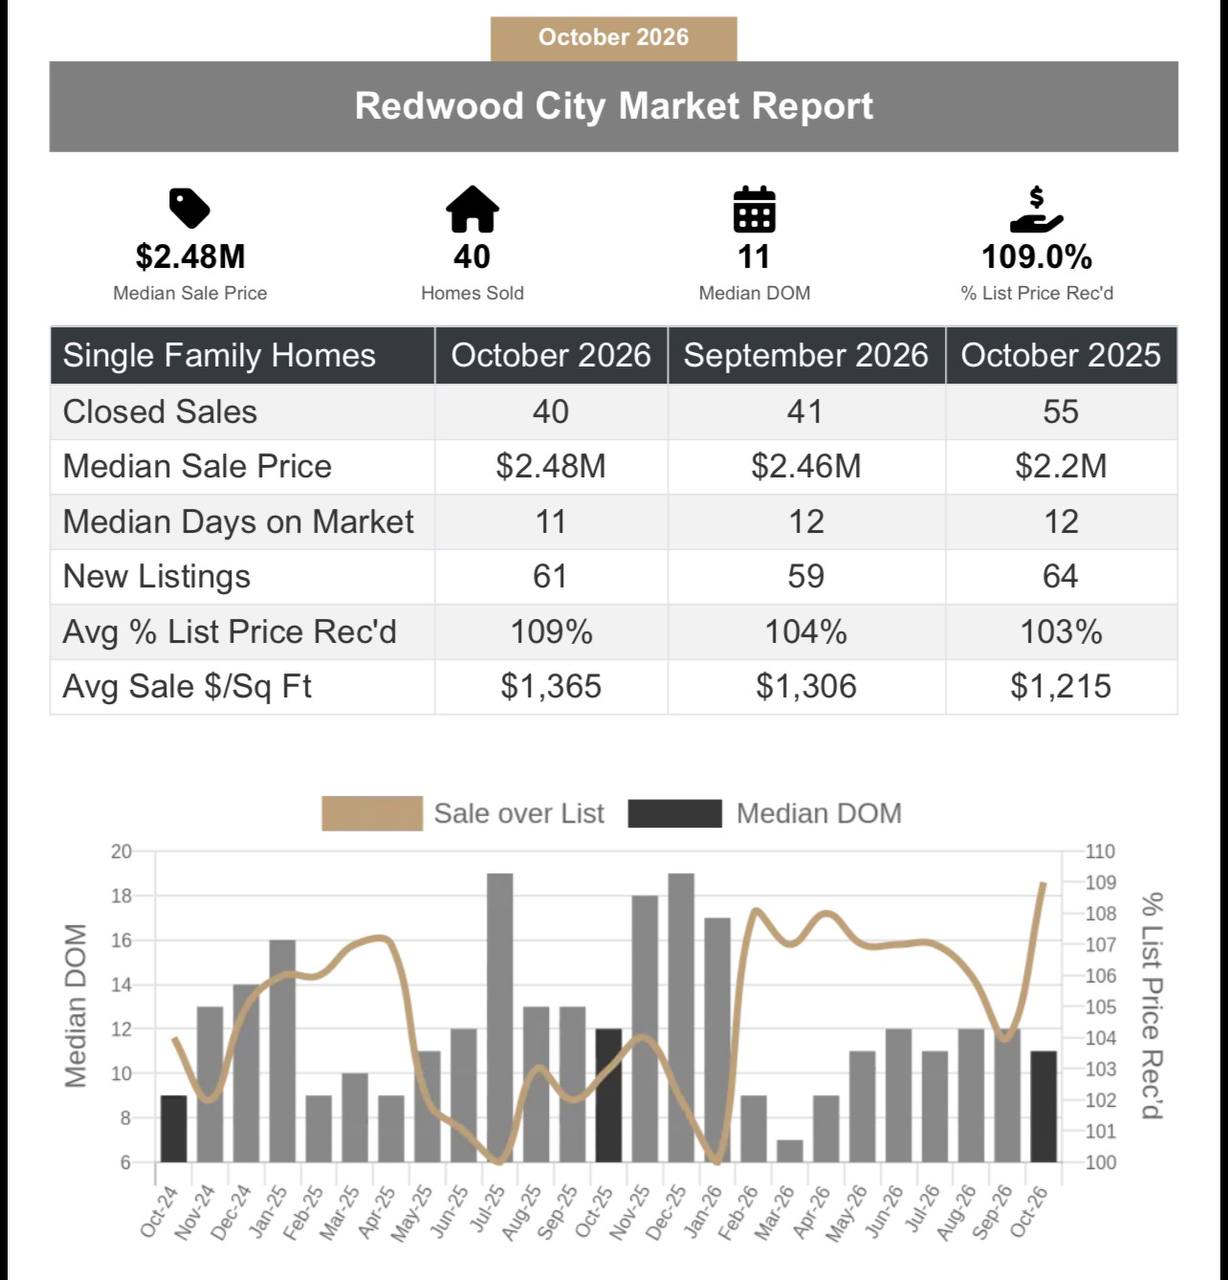
- Redwood City: $2.48 million median sale price; $1,365 average per square foot; 11 median days; 40 closed sales; 61 new listings; 109% average sale-to-list.
Palo Alto, Menlo Park, Burlingame and Atherton
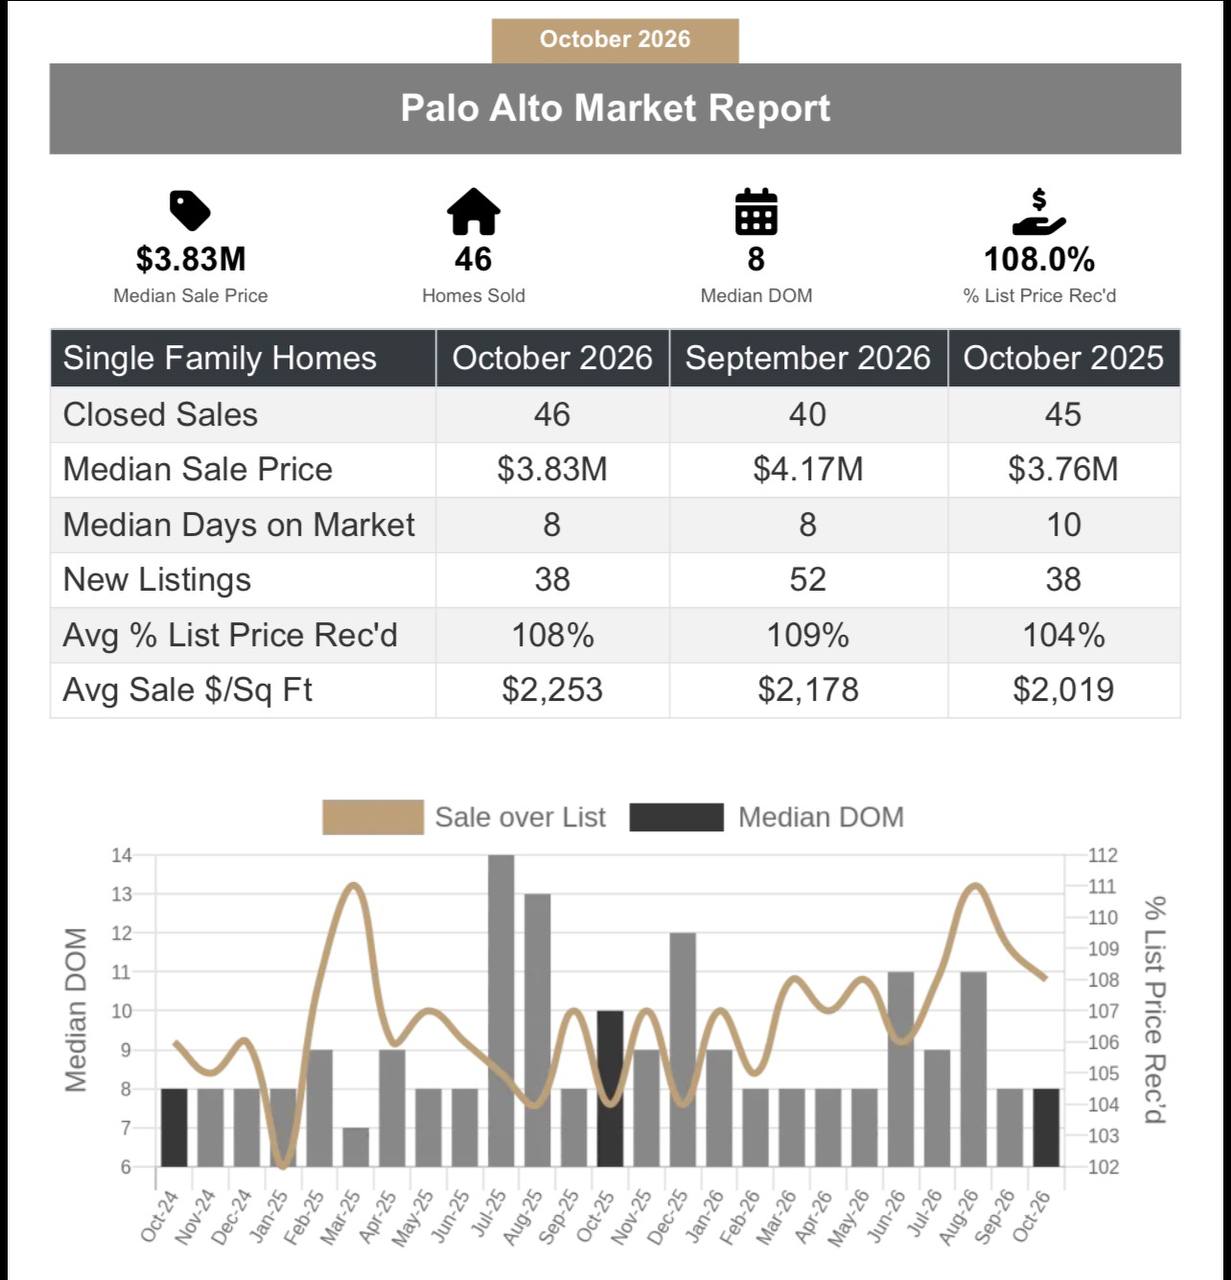
- Palo Alto: $3.83 million median sale price; $2,253 average per square foot; 8 median days; 46 closed sales; 38 new listings; 108% average sale-to-list.
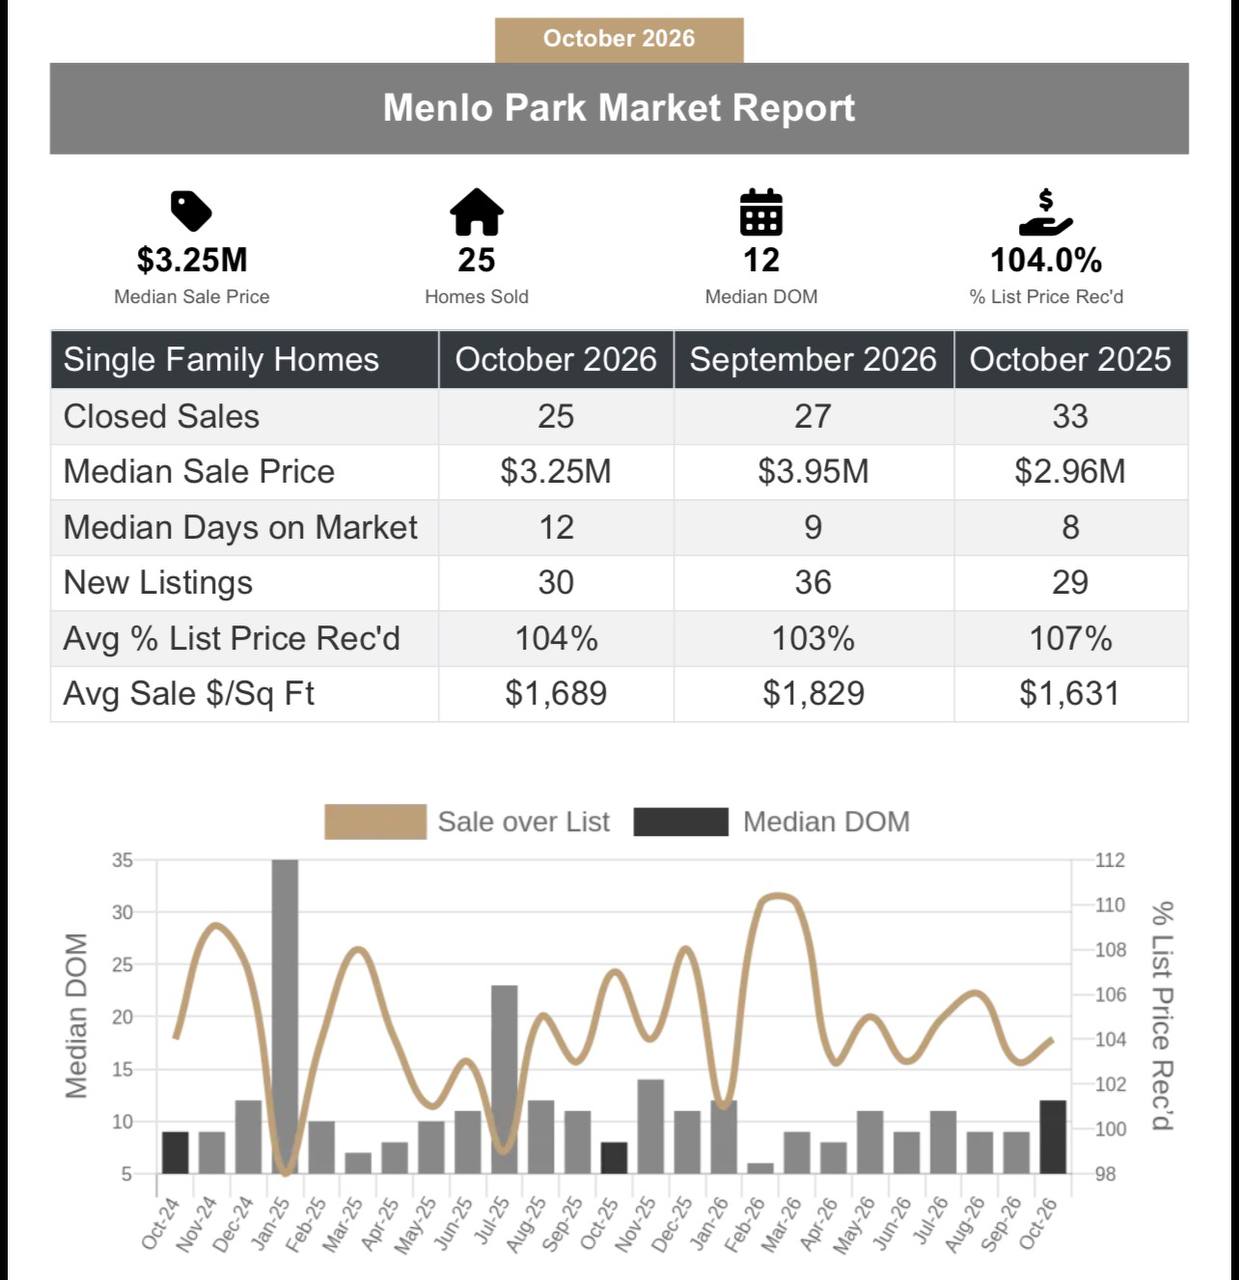
- Menlo Park: $3.25 million median sale price; $1,689 average per square foot; 12 median days; 25 closed sales; 30 new listings; 104% average sale-to-list.
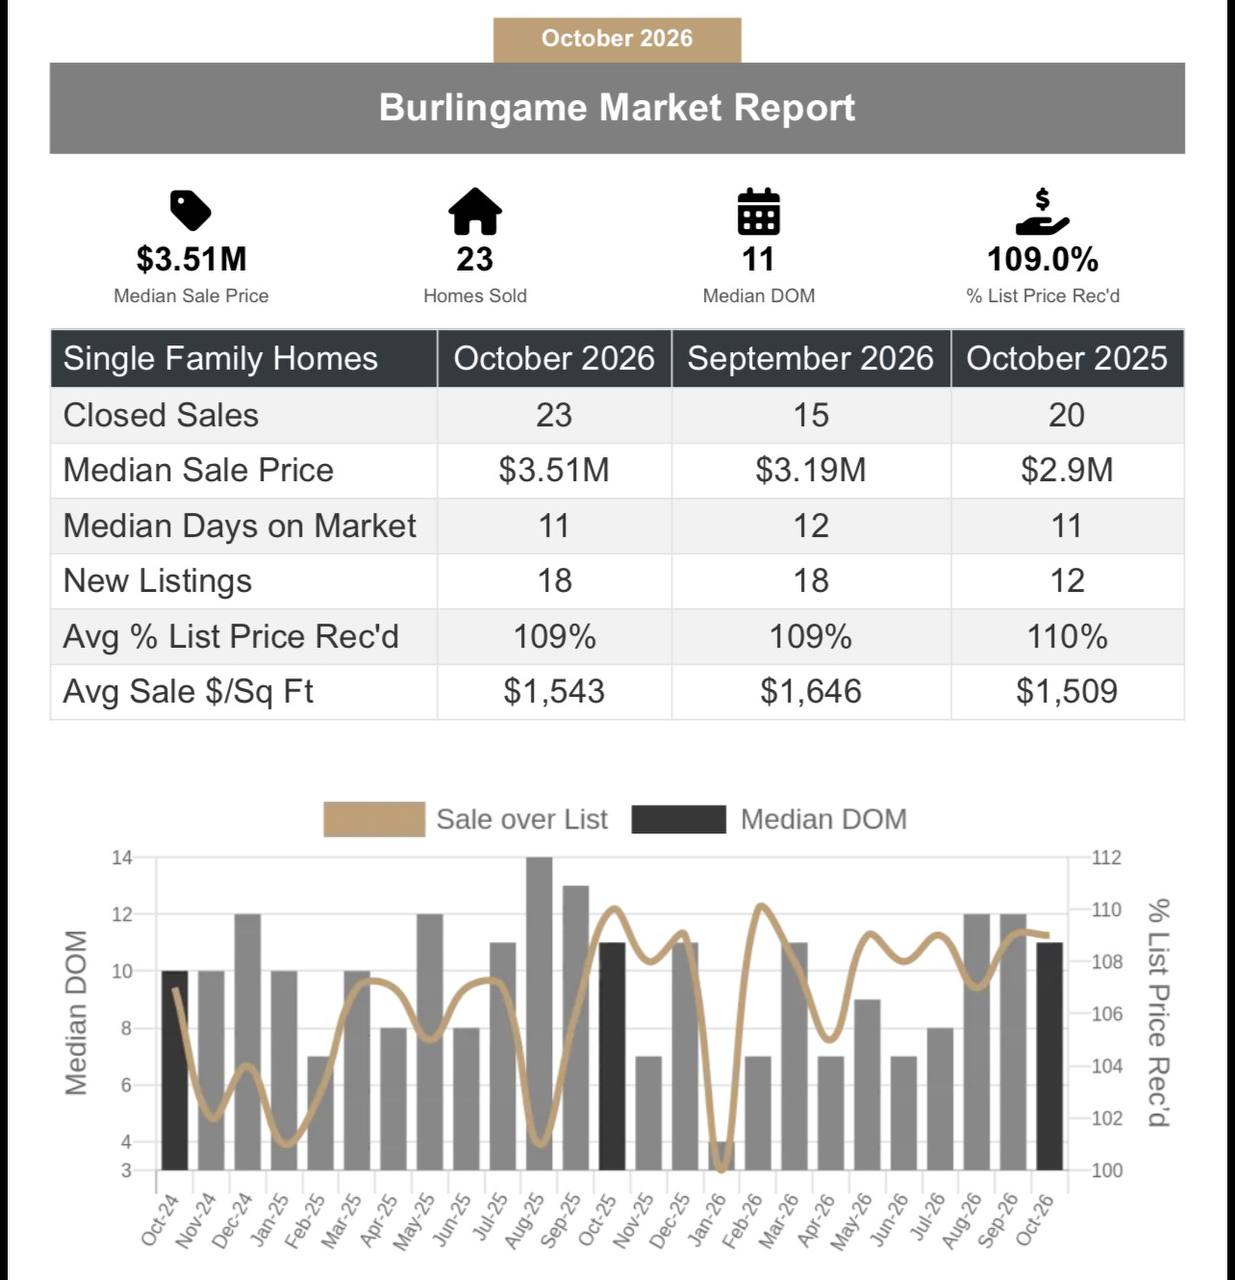
- Burlingame: $3.51 million median sale price; $1,543 average per square foot; 11 median days; 23 closed sales; 18 new listings; 109% average sale-to-list.
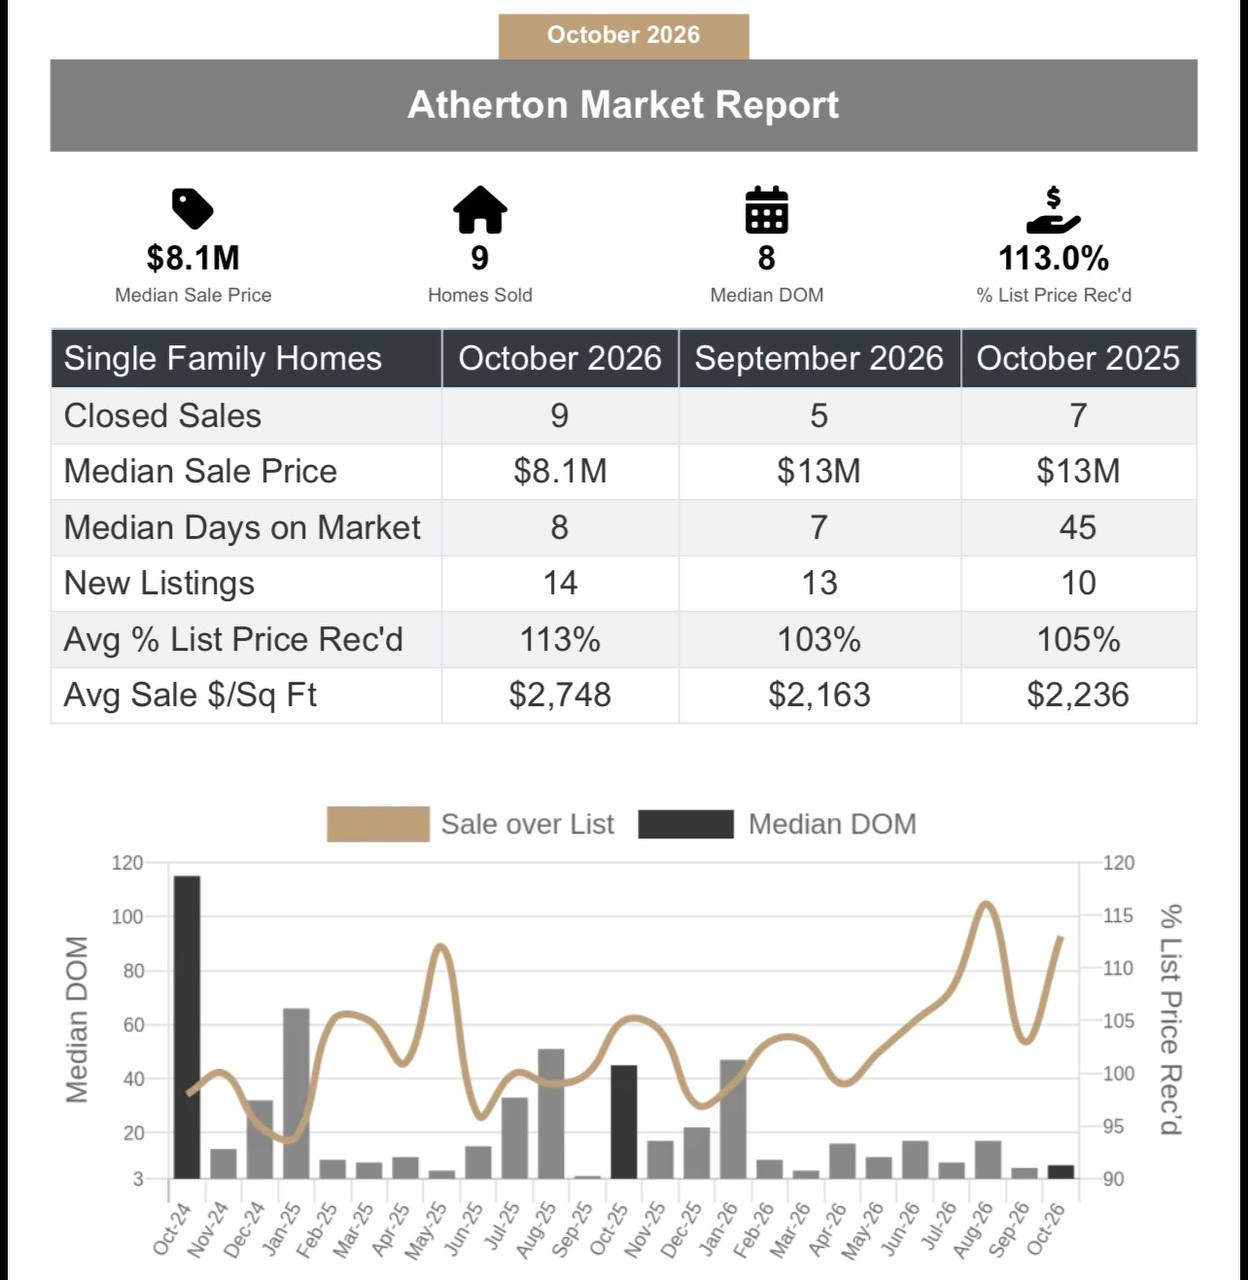
- Atherton: $8.1 million median sale price; $2,748 average per square foot; 8 median days; 9 closed sales; 14 new listings; 113% average sale-to-list.
San Carlos, Belmont, Foster City, Millbrae and San Bruno
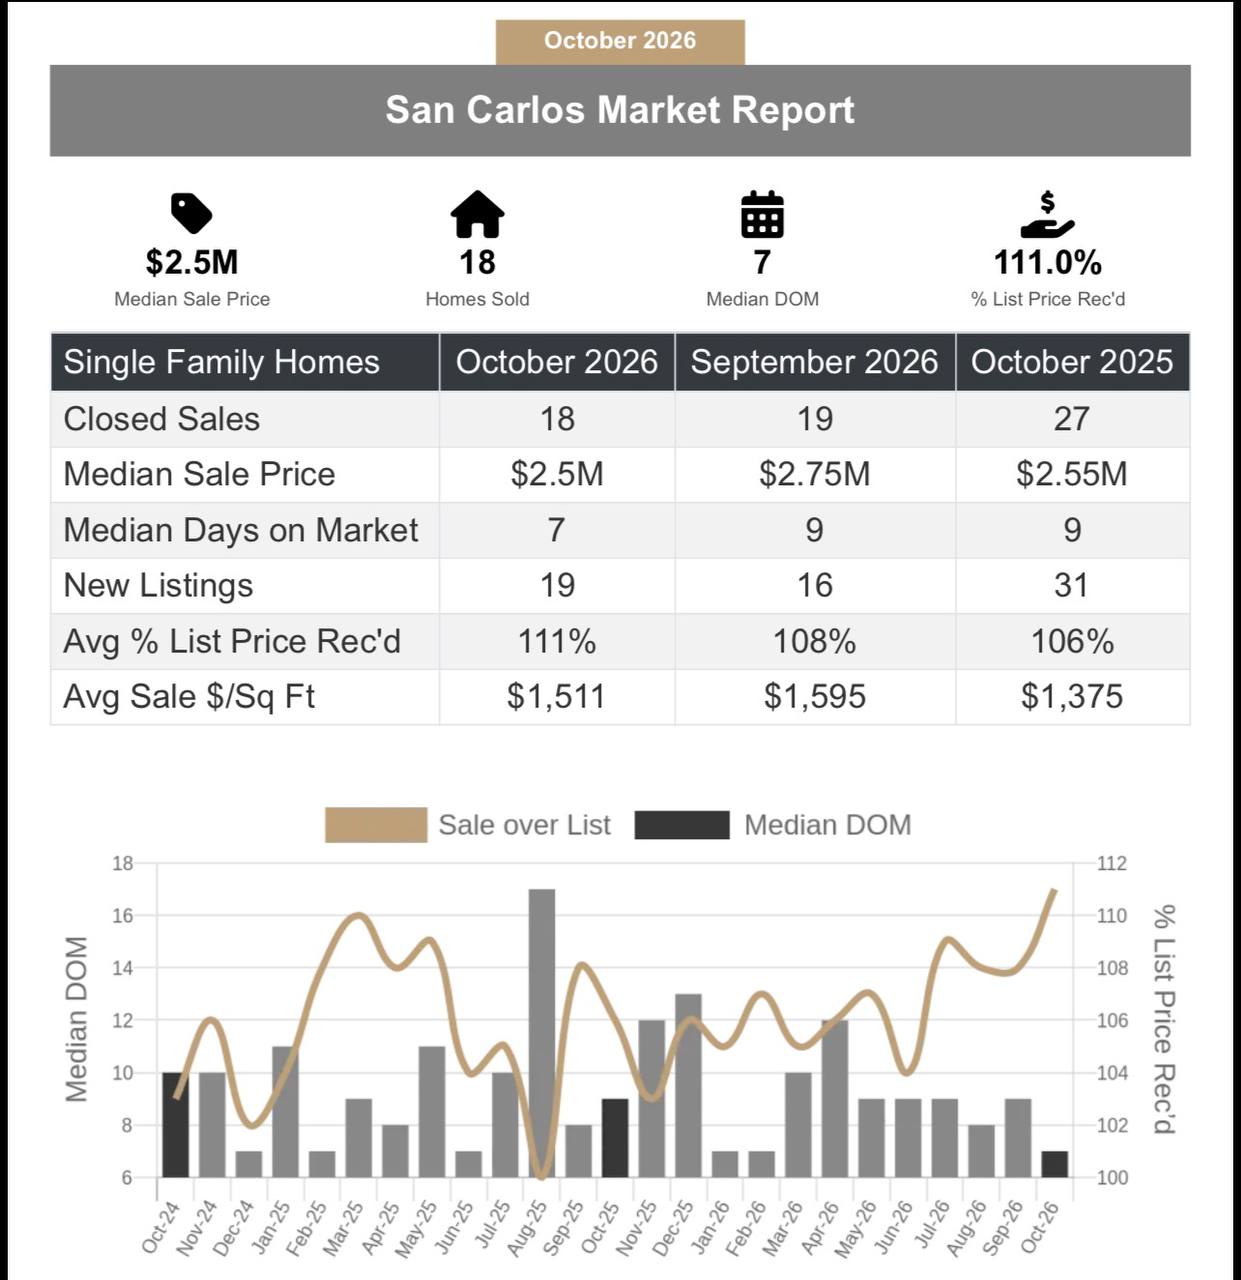
- San Carlos: $2.5 million median sale price; $1,511 average per square foot; 7 median days; 18 closed sales; 19 new listings; 111% average sale-to-list.
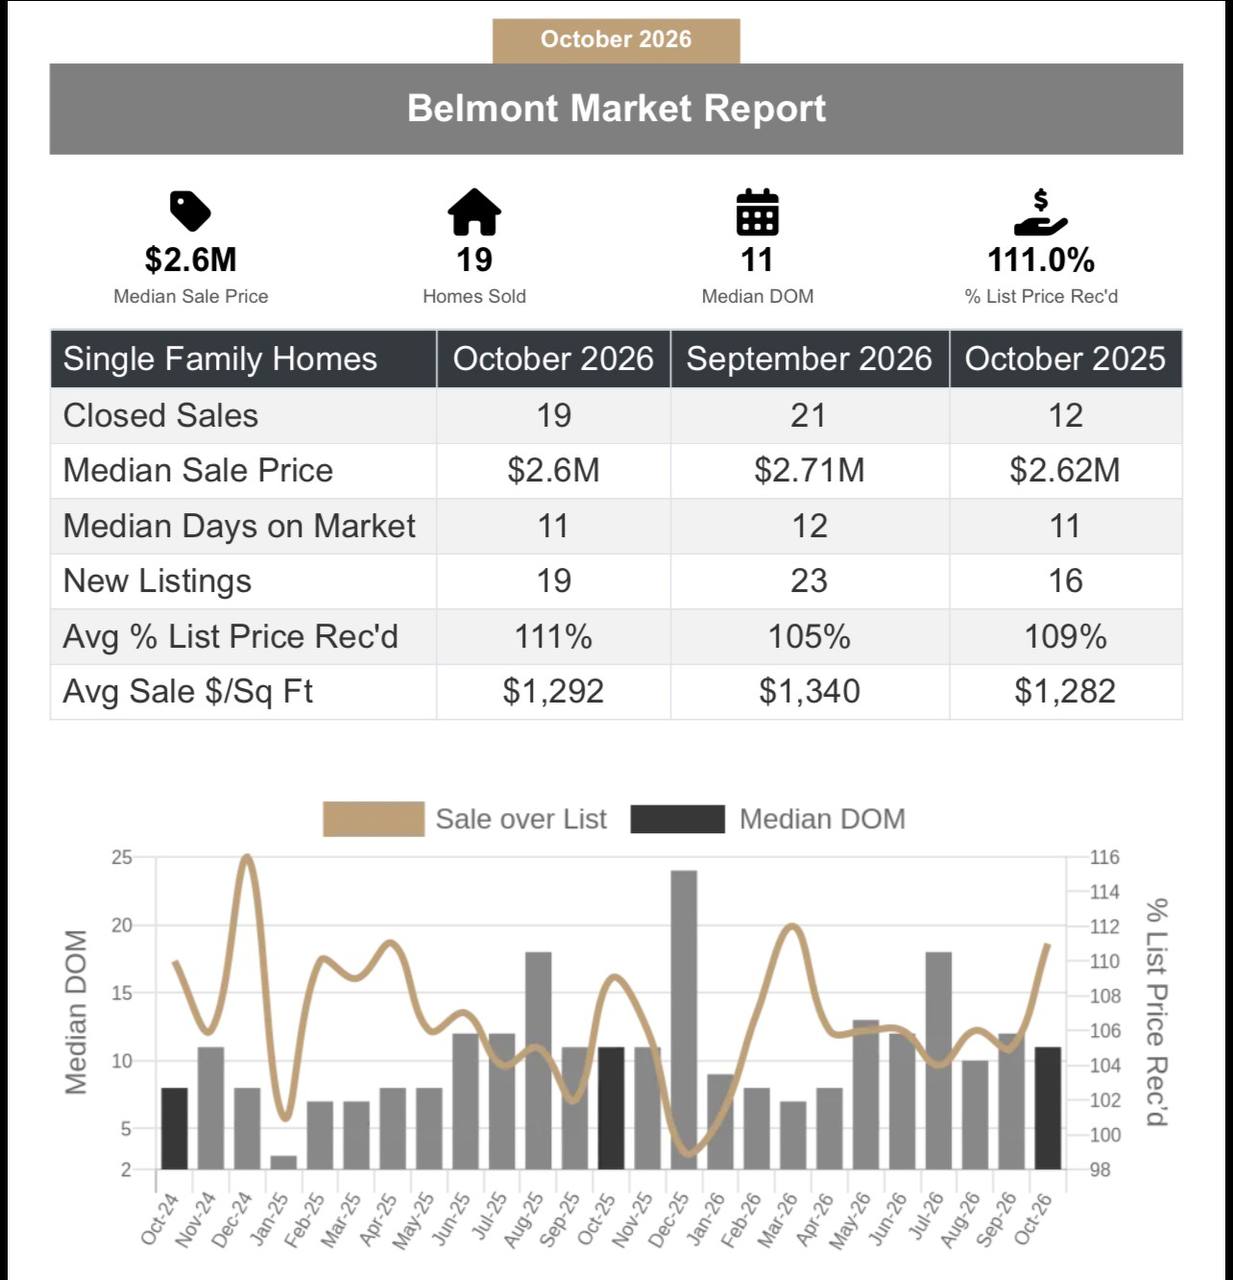
- Belmont: $2.6 million median sale price; $1,292 average per square foot; 11 median days; 19 closed sales; 19 new listings; 111% average sale-to-list.
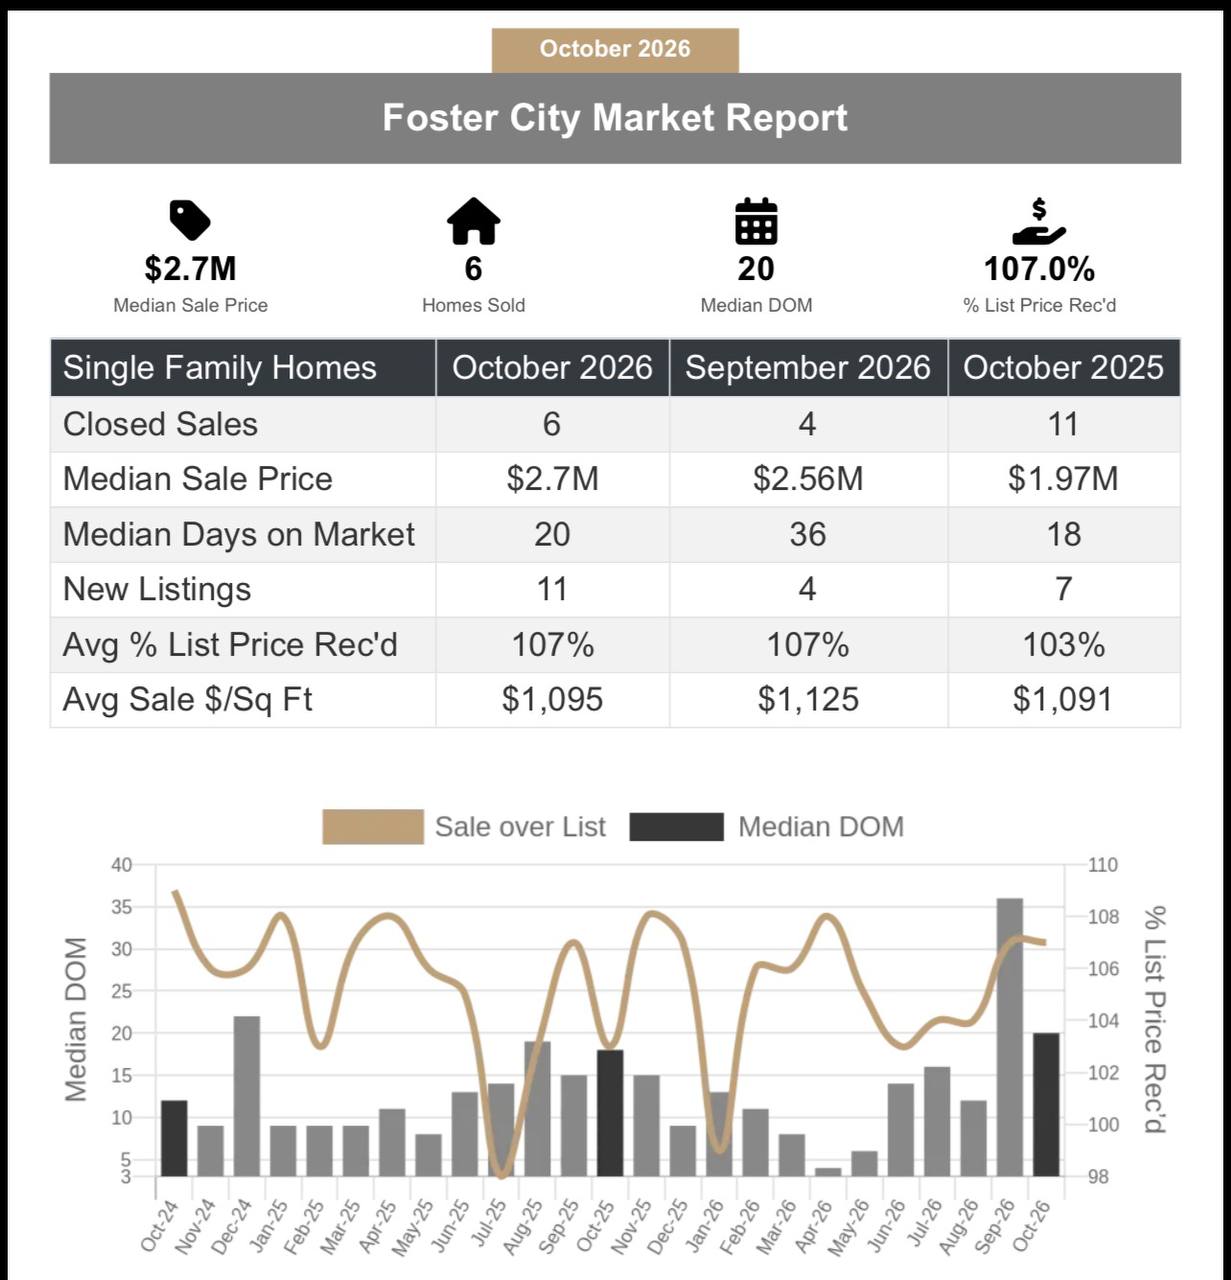
- Foster City: $2.7 million median sale price; $1,095 average per square foot; 20 median days; 6 closed sales; 11 new listings; 107% average sale-to-list.
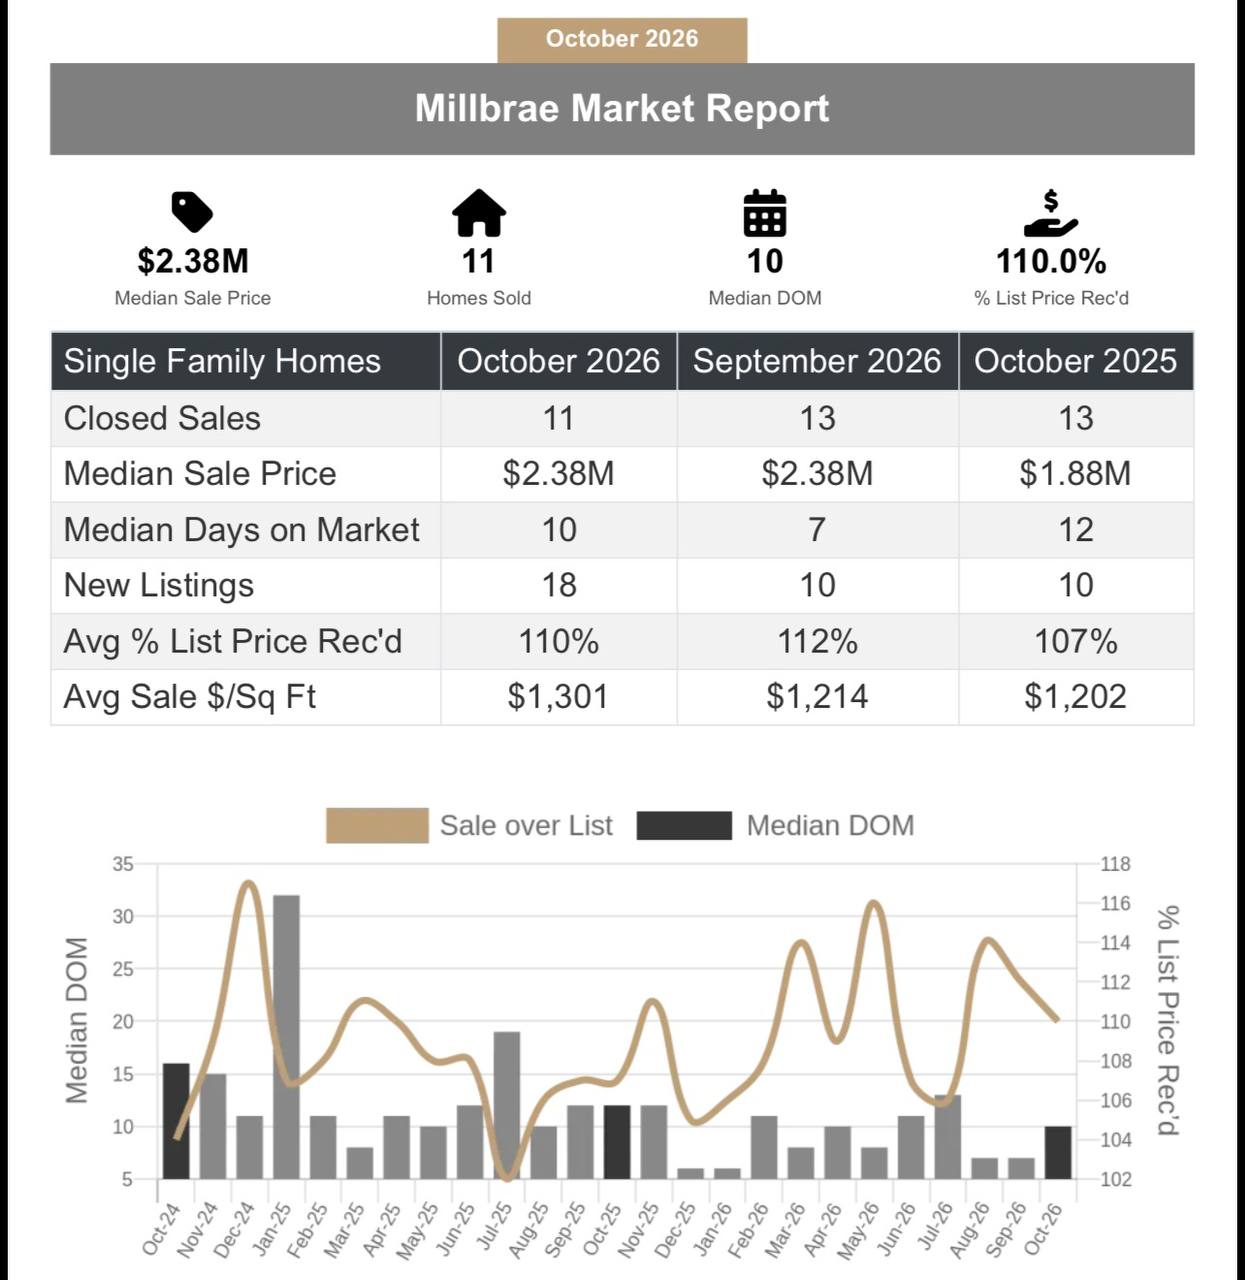
- Millbrae: $2.38 million median sale price; $1,301 average per square foot; 10 median days; 11 closed sales; 18 new listings; 110% average sale-to-list.
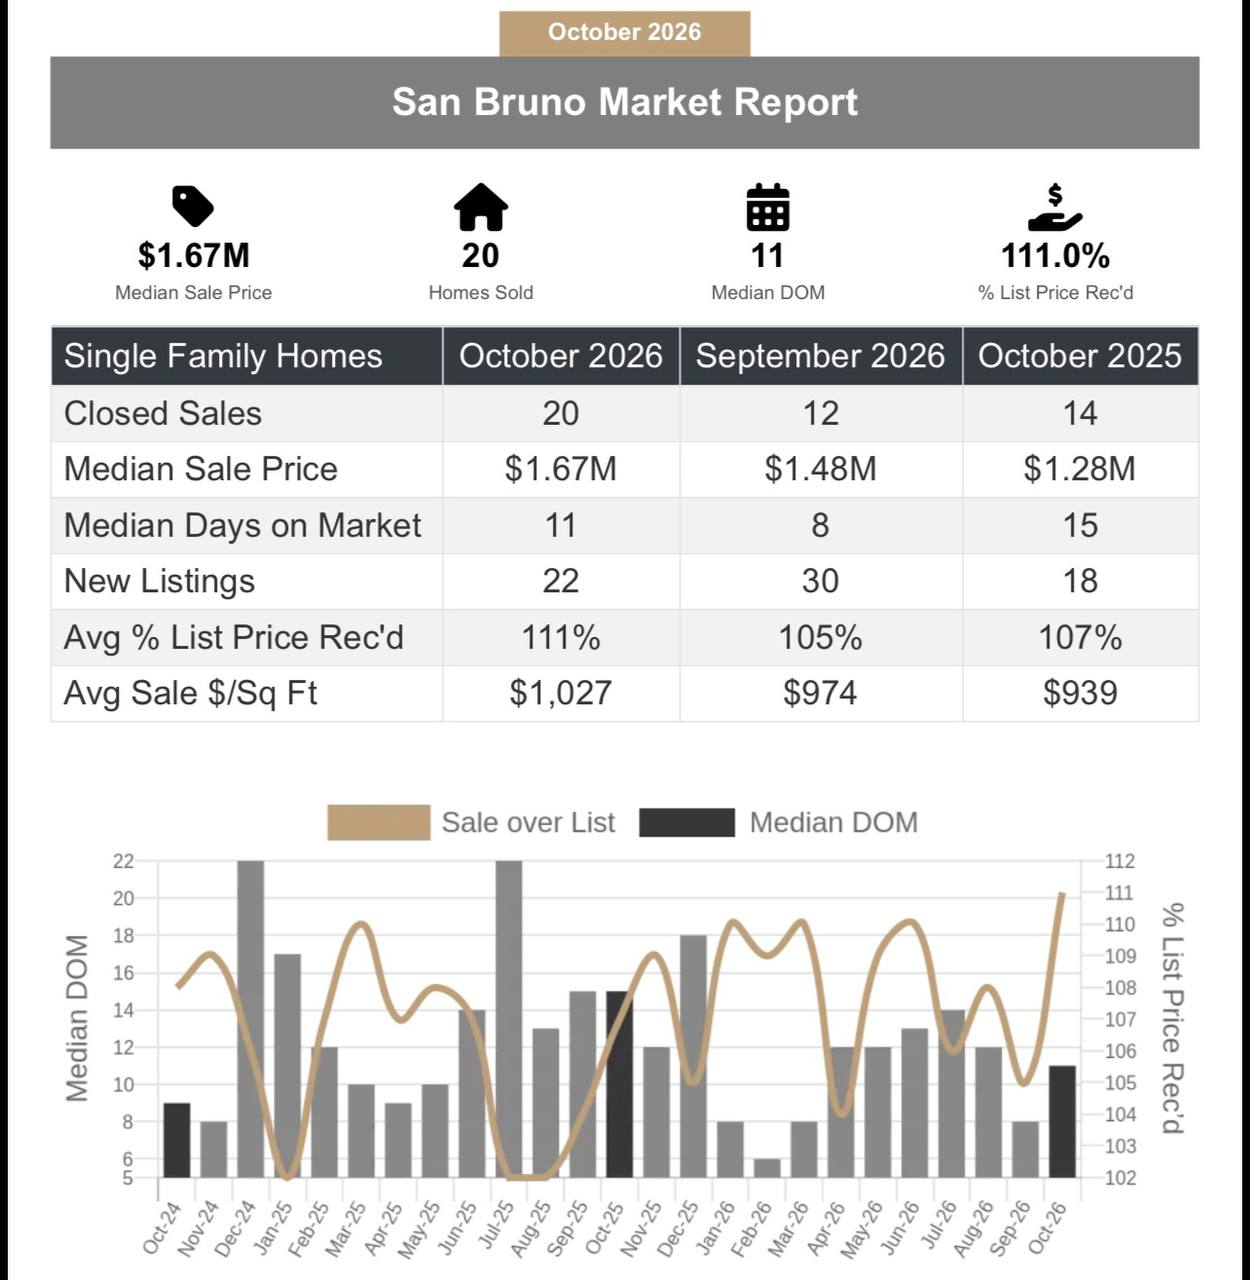
- San Bruno: $1.67 million median sale price; $1,027 average per square foot; 11 median days; 20 closed sales; 22 new listings; 111% average sale-to-list.
Atherton: a lower median alongside stronger over-asking results
Atherton’s reported median sale price moved from $13 million in September to $8.1 million in October. Taken alone, that is a dramatic change. But September had just five closed sales, compared with nine in October. With small samples, a different mix of properties can move the median sharply.
Other measures told a different story. Atherton’s average percentage of list price received rose from 103% to 113%, while its average sale price per square foot increased from $2,163 to $2,748. Median days on market moved from seven to eight.
Those figures describe different features of the transactions that closed. They do not establish that a particular Atherton home lost value simply because the city’s median fell. For a specific property, comparable homes, lot characteristics, condition and the terms of recent sales are more useful than applying the monthly median change to its value.
Price changes were mixed across the Peninsula
The reported median rose from September to October in San Mateo ($2.17 million to $2.38 million), Burlingame ($3.19 million to $3.51 million) and San Bruno ($1.48 million to $1.67 million).
Over the same period, Palo Alto’s median moved from $4.17 million to $3.83 million, and Menlo Park’s from $3.95 million to $3.25 million. San Carlos moved from $2.75 million to $2.5 million, while Belmont moved from $2.71 million to $2.6 million.
Foster City’s median rose from $2.56 million to $2.7 million, based on six October sales. Millbrae’s reported median was unchanged at $2.38 million. These are comparisons of each month’s closed-sale mix, not a repeat-sales measure tracking the same homes over time.
Competition and speed were not uniform
San Carlos had the shortest reported median selling time: seven days. Palo Alto and Atherton followed at eight days. Foster City’s 20-day median was longer than the other markets in this report, although it was down from 36 days in September.
Redwood City’s reported average sale-to-list ratio increased from 104% in September to 109% in October. Its October figures included 40 closed sales and 61 new listings. New listings and closed sales are different groups of properties; subtracting one from the other does not establish the change in available inventory.
An average sale-to-list ratio above 100% can coexist with a lower median sale price. Asking prices, property mix and the results of individual negotiations all matter. It is not a measure of annual appreciation, and it is not the percentage of homes that received multiple offers.
The city report images
Open any report below at its original supplied resolution to read the comparison columns and historical chart. The Atherton report appears above; the other ten city reports follow. These are the original report images, not reconstructed charts.
San Mateo
Redwood City
Palo Alto
Menlo Park
Burlingame
San Carlos
Belmont
Foster City
Millbrae
San Bruno
What buyers and sellers can take from this
For buyers: use the city figures to understand the setting, then evaluate the particular home. Recent comparable sales, inspection and disclosure findings, financing and the property’s asking-price strategy should guide an offer. An above-asking market average is not a reason to bid a fixed percentage above every listing.
For sellers: a fast city median does not promise a fast sale for every home. Choose comparable properties carefully and account for differences in lot, condition, location and presentation. An aspirational asking price can change how a listing competes, even in a market where the average sale-to-list ratio is above 100%.
The takeaway: October’s reports show above-asking averages across all 11 cities, alongside mixed monthly median prices. The useful question is not simply whether “the Peninsula is up or down,” but how the most relevant homes are trading in your part of the market.
Source and methodology notes
Source: October 2026 single-family city market reports and accompanying summary shared by ShopProp, citing MLS data. Figures were transcribed from the supplied report images and summary; the underlying MLS export was not independently re-run for this article. These are city-market statistics, not ShopProp transaction counts. Reported prices retain the source’s rounding. Small samples and changes in the mix of homes sold can affect comparisons. The figures are not appraisals or forecasts for individual properties.
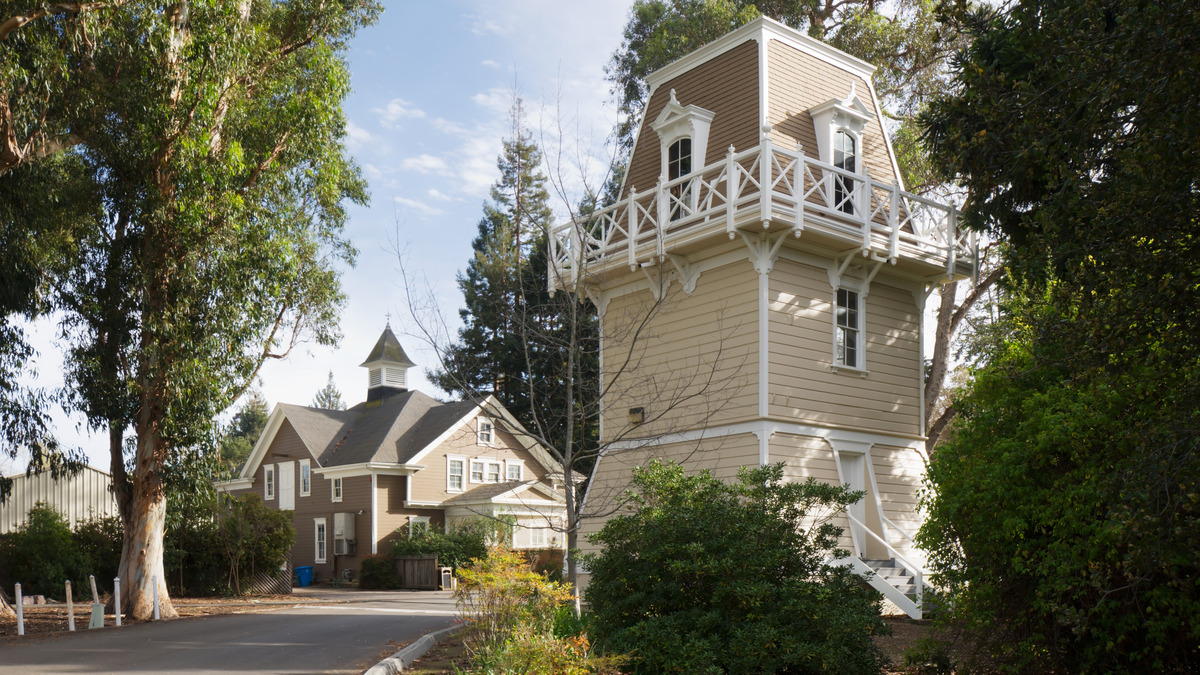
Cover photo: Historic carriage house and water tower at Holbrook-Palmer Park in Atherton, photographed in 2014 by LPS.1, via Wikimedia Commons. CC0 1.0 public-domain dedication. Cropped and resized for the cover; no generative edits. This is an illustrative park photograph, not a home offered for sale.
Talk with ShopProp about buying or selling on the Peninsula →